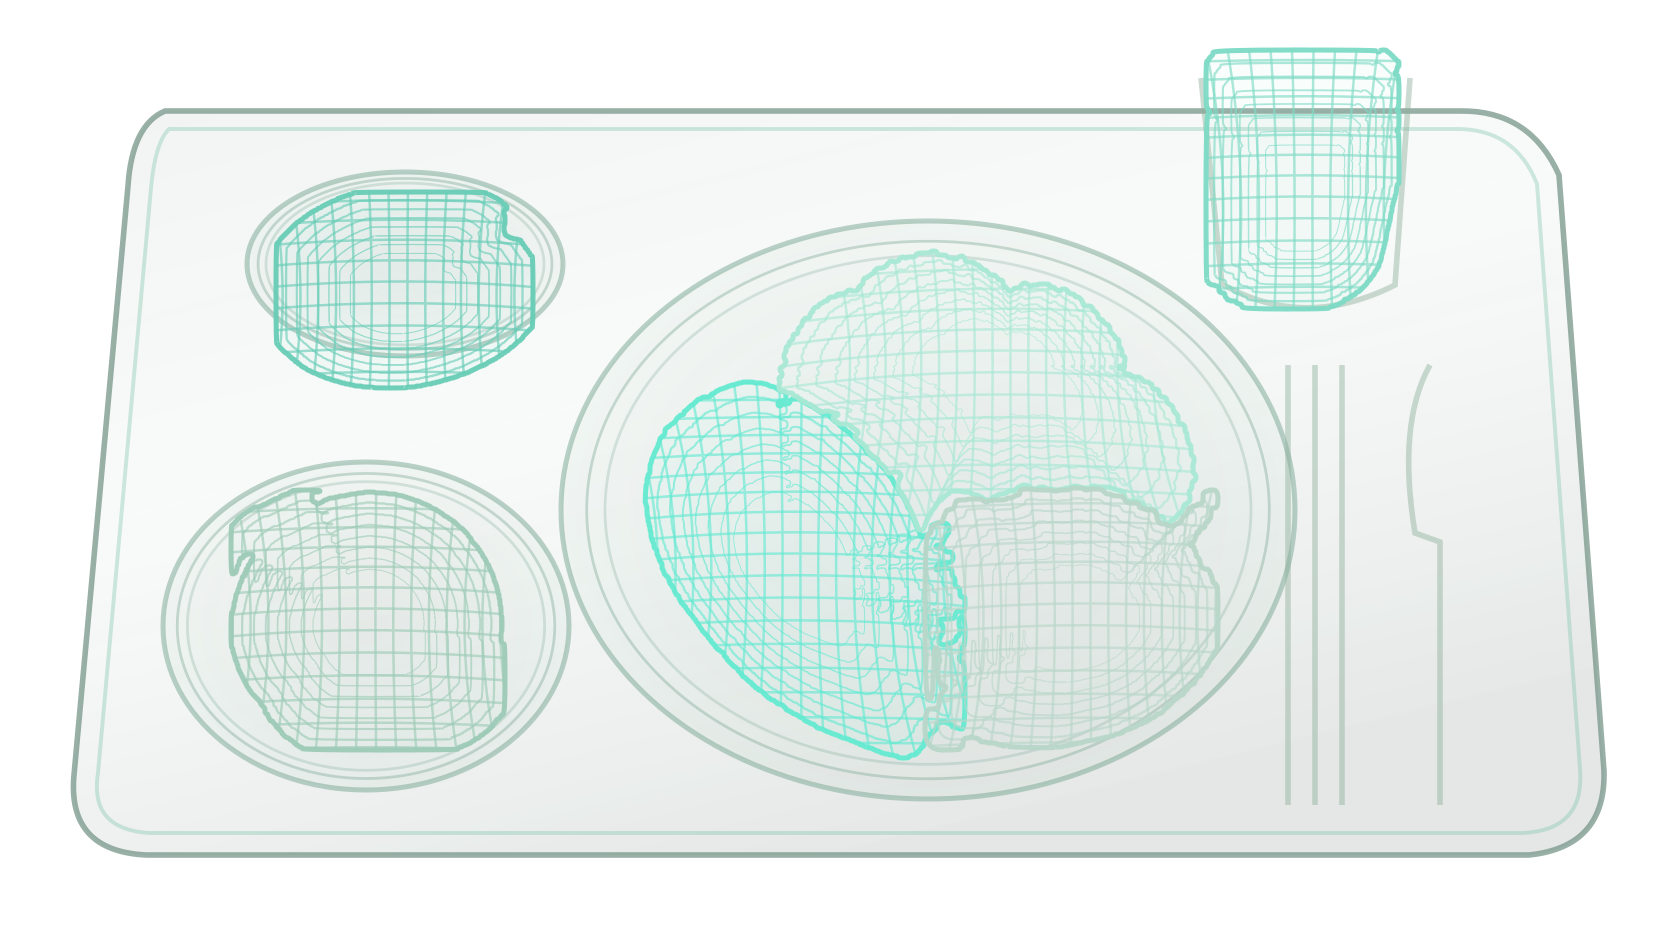

Concept artwork of food regions on a meal plate

NUTRITION INTELLIGENCE

From meals
to better care

Verify trays before delivery and make meal intake visible to the care team

Official Nuvilab symbol in mint

Every mealtells us more

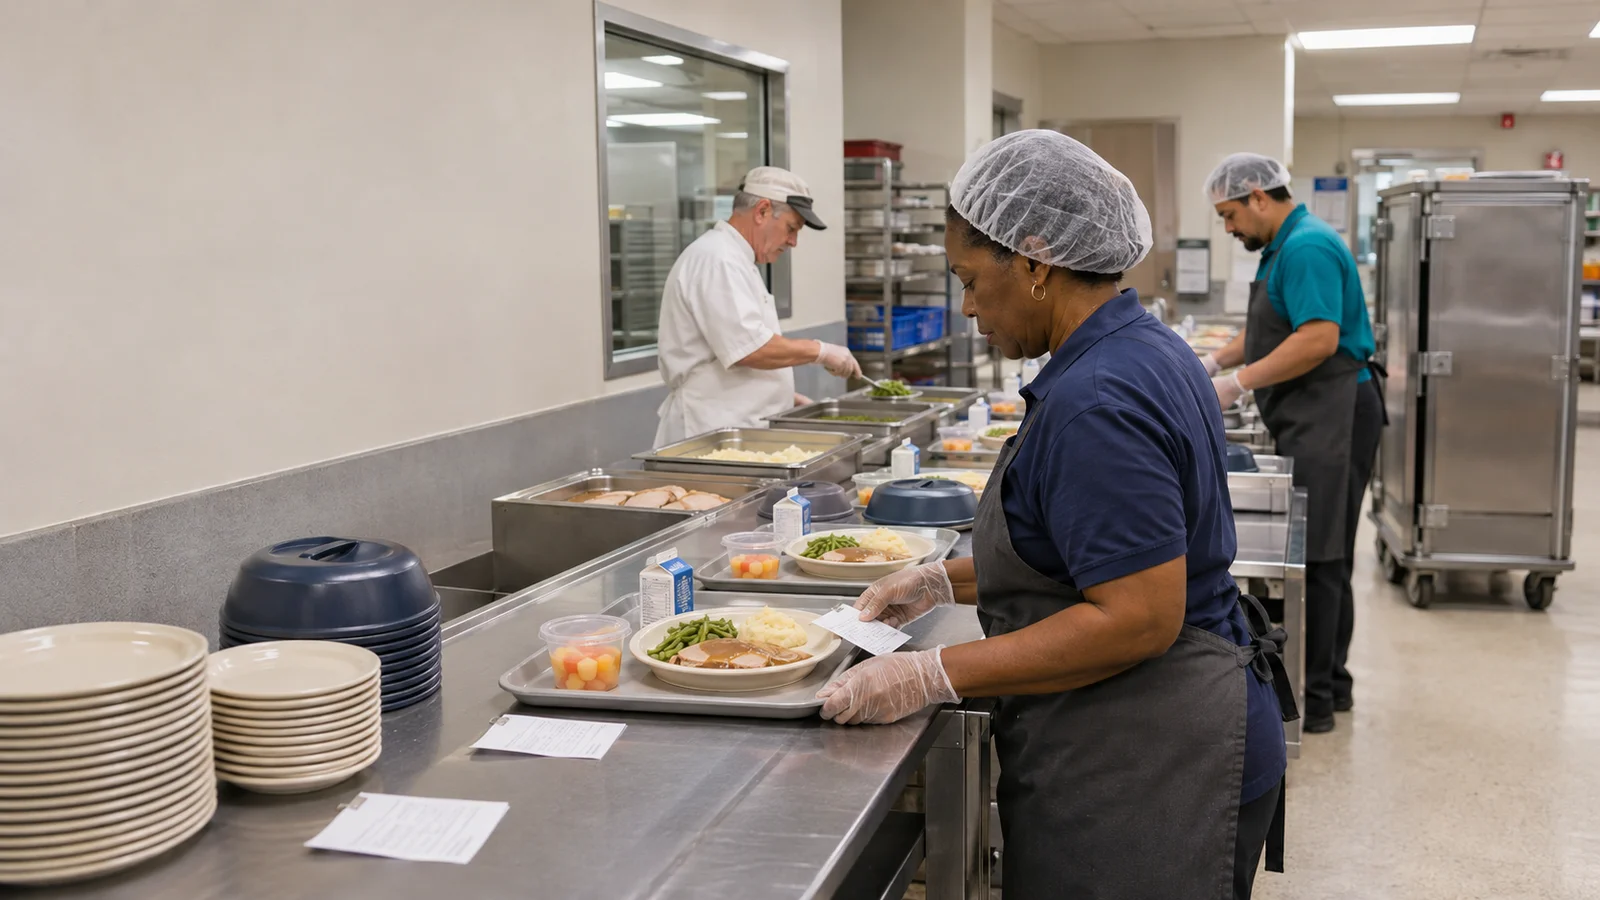
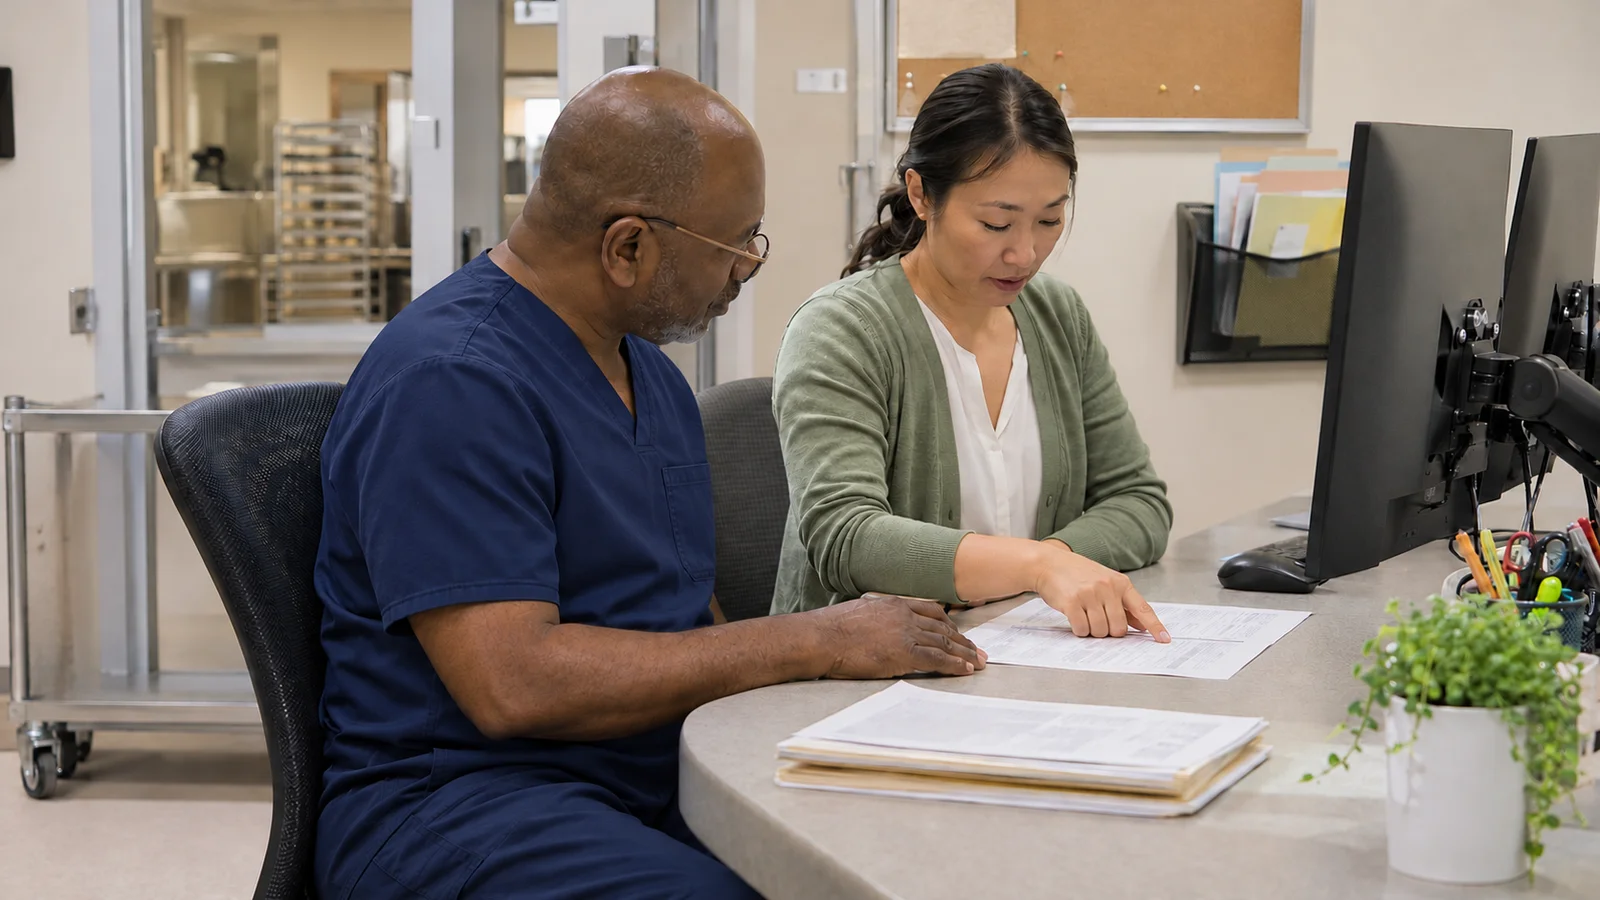
Illustration · Hospital foodservice team
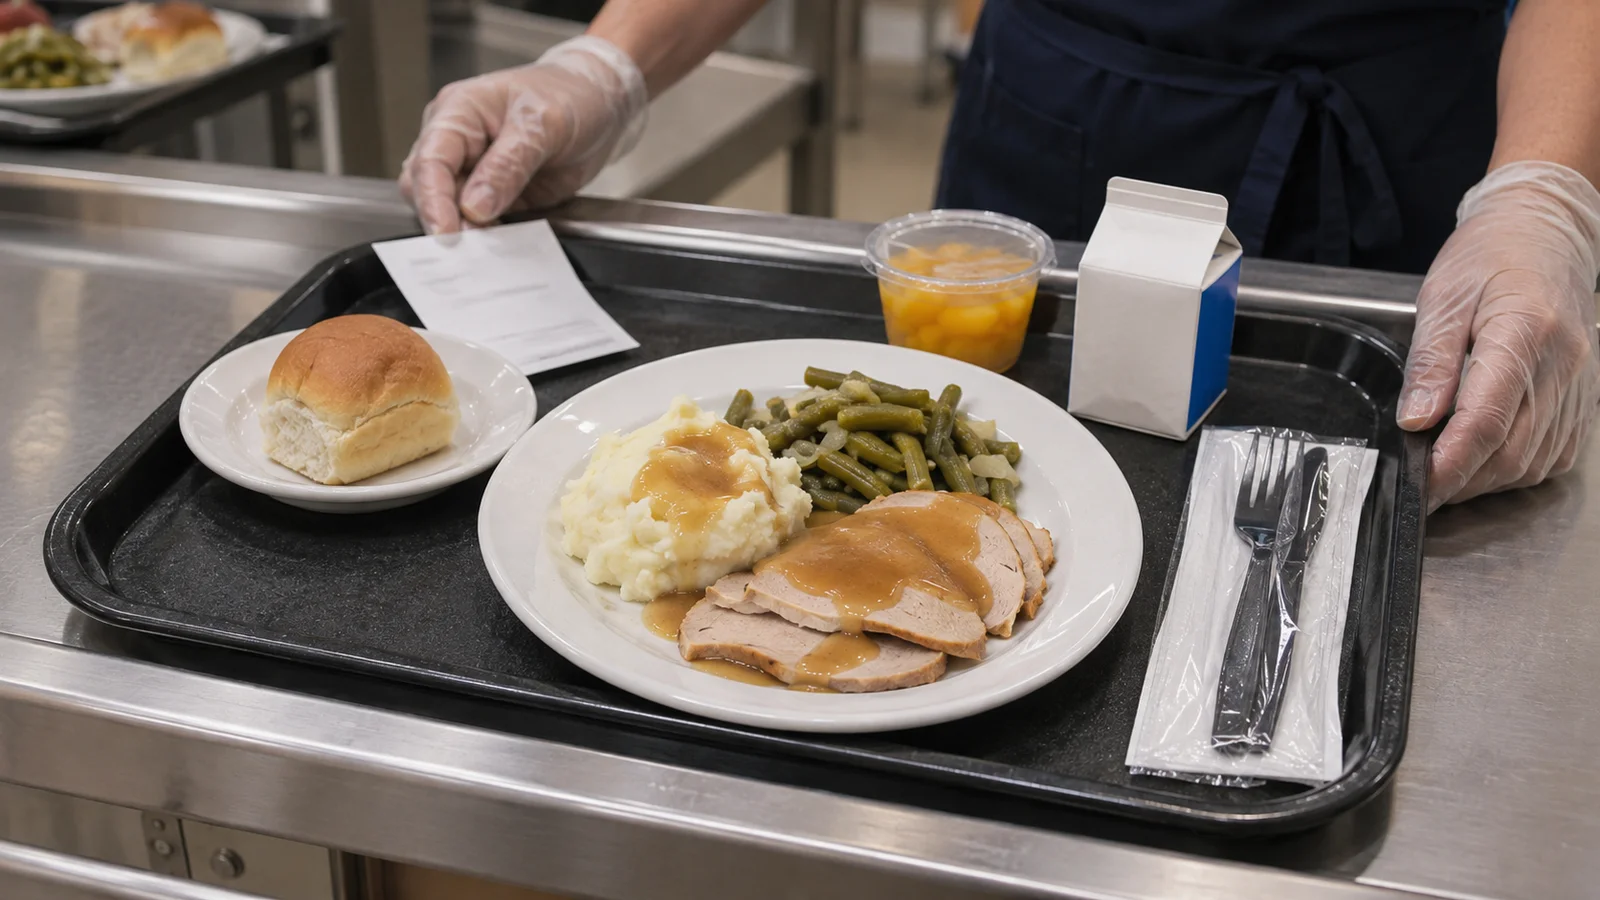
Illustration · A prepared patient meal
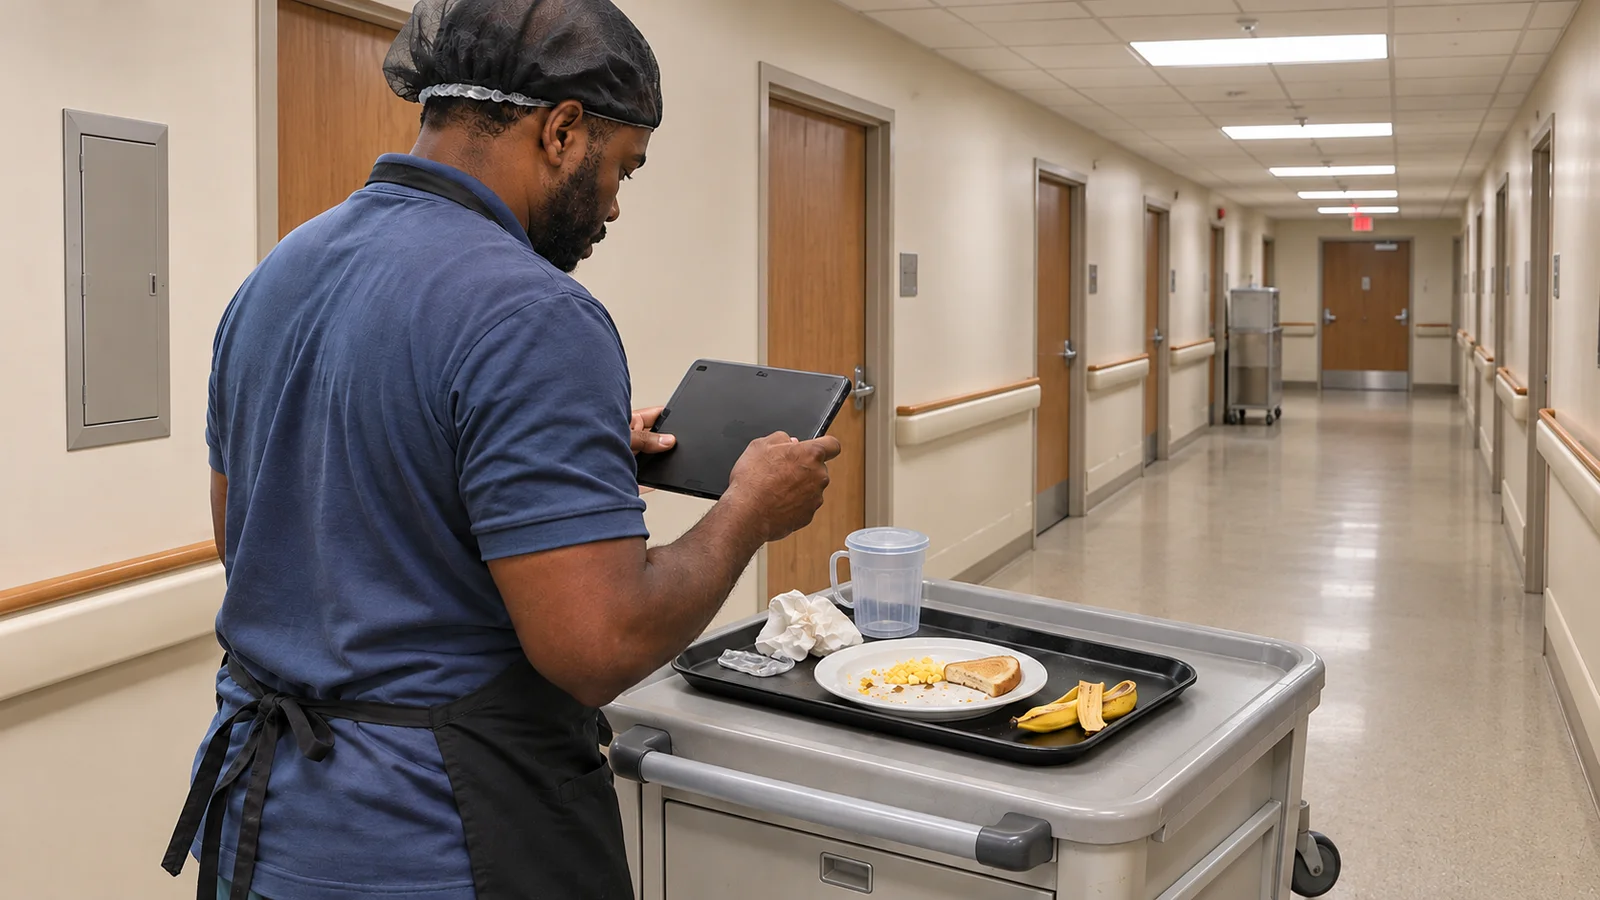
Illustration · Meal delivery on the ward
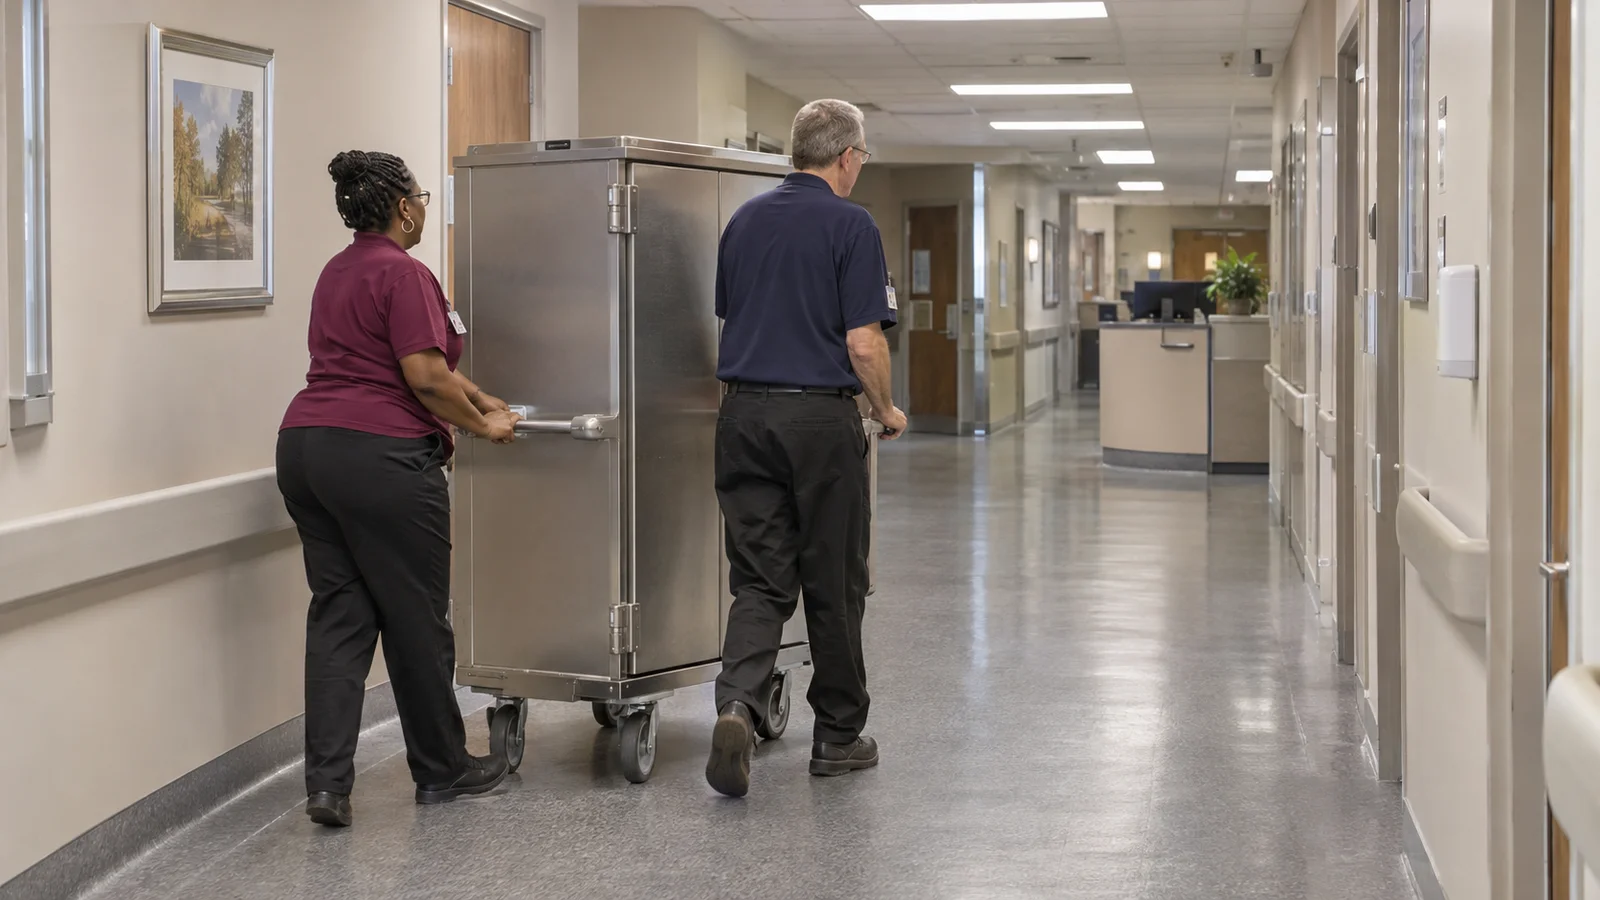
Foodservice staff photographing a collected meal tray on a mobile cart in a hospital ward corridor
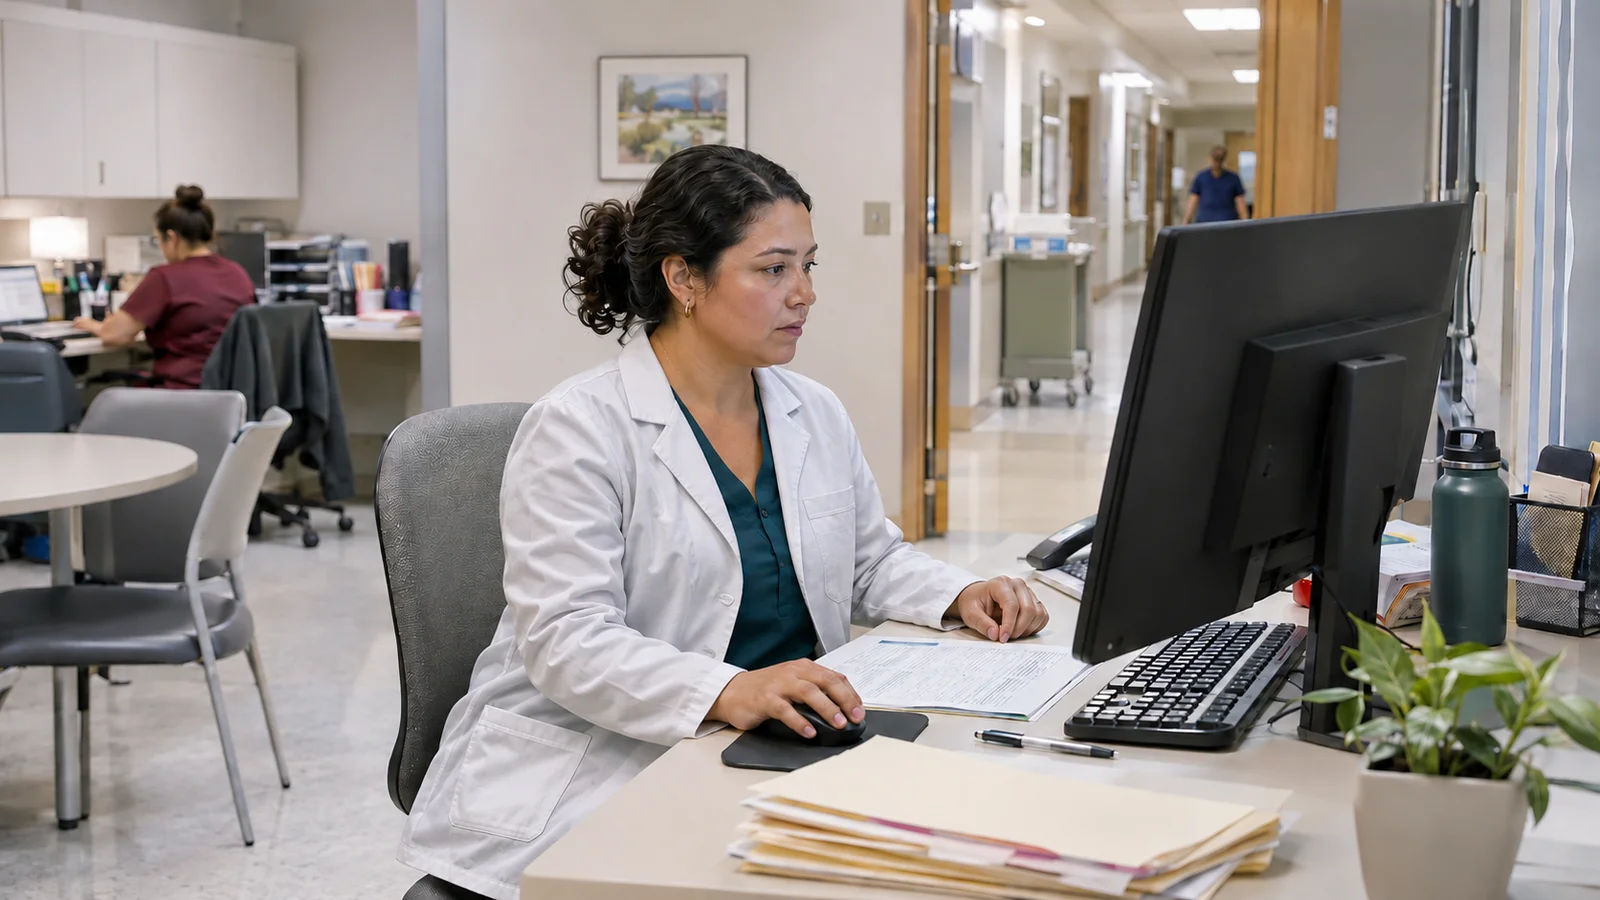
Illustration · Dietitian intake review
Illustration · Nutrition-team collaboration
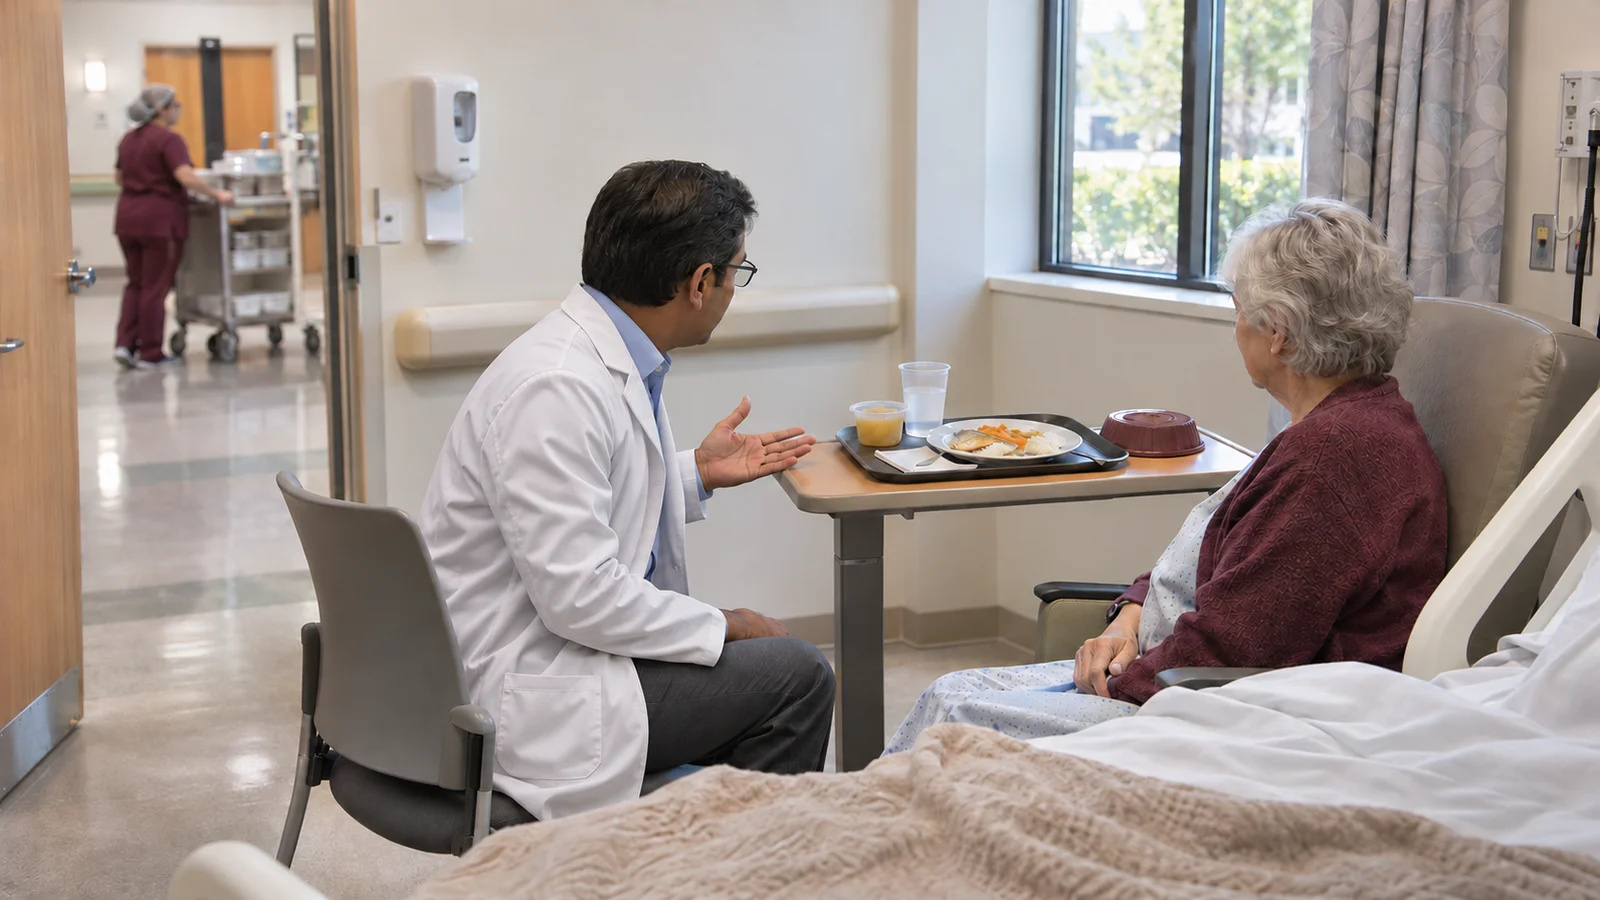
Illustration · A conversation around the meal
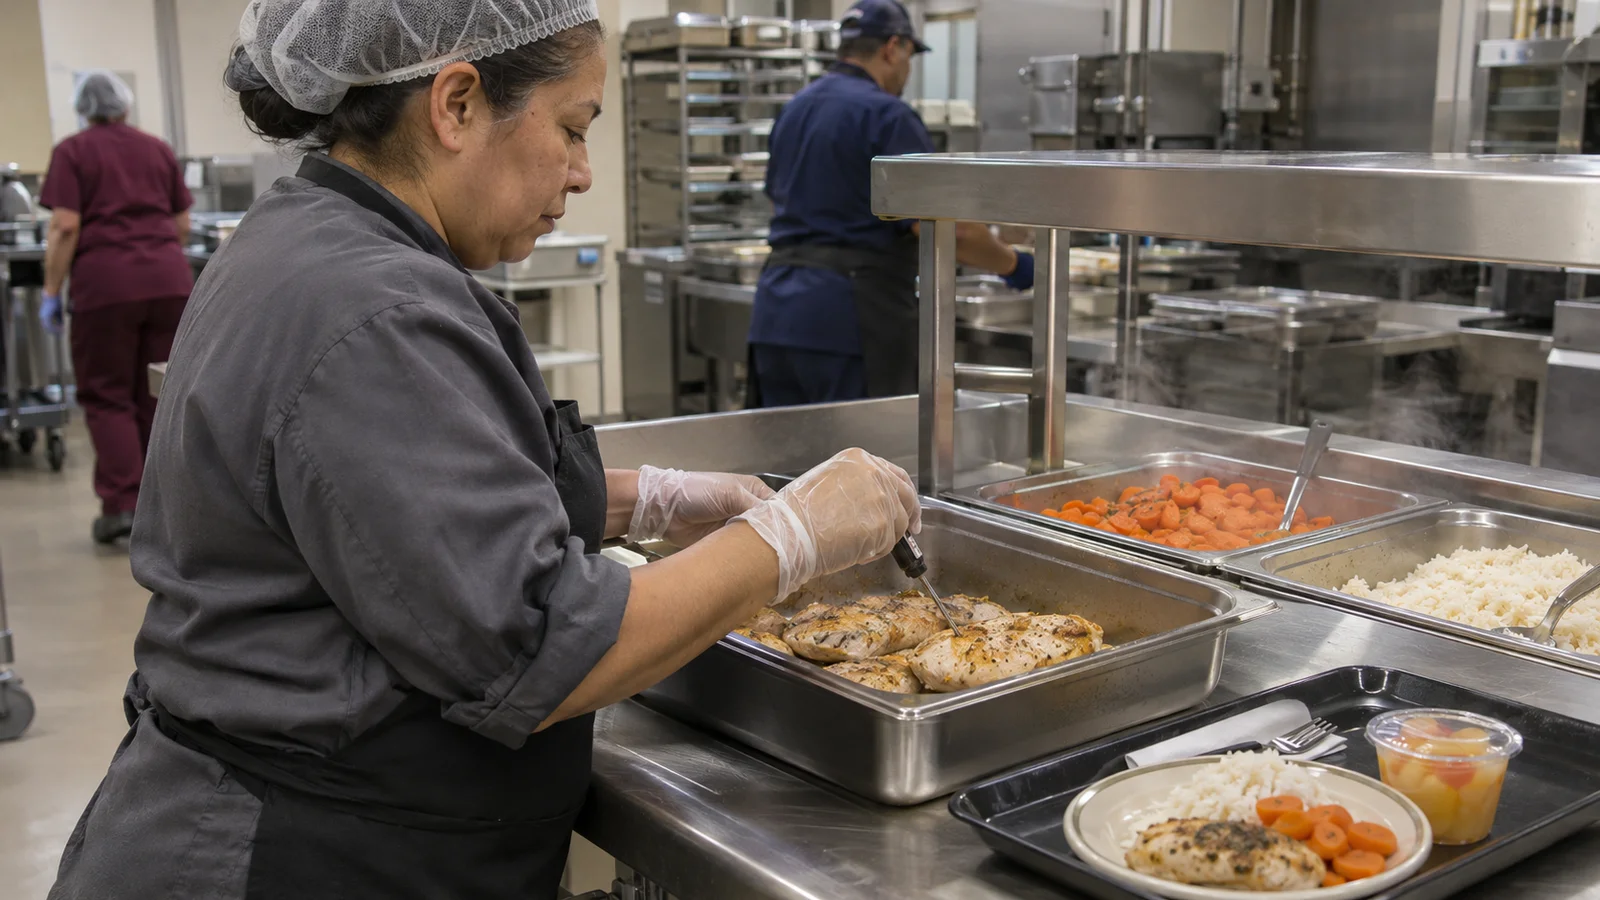
Illustration · Kitchen temperature check
Nutrition AI · Product context
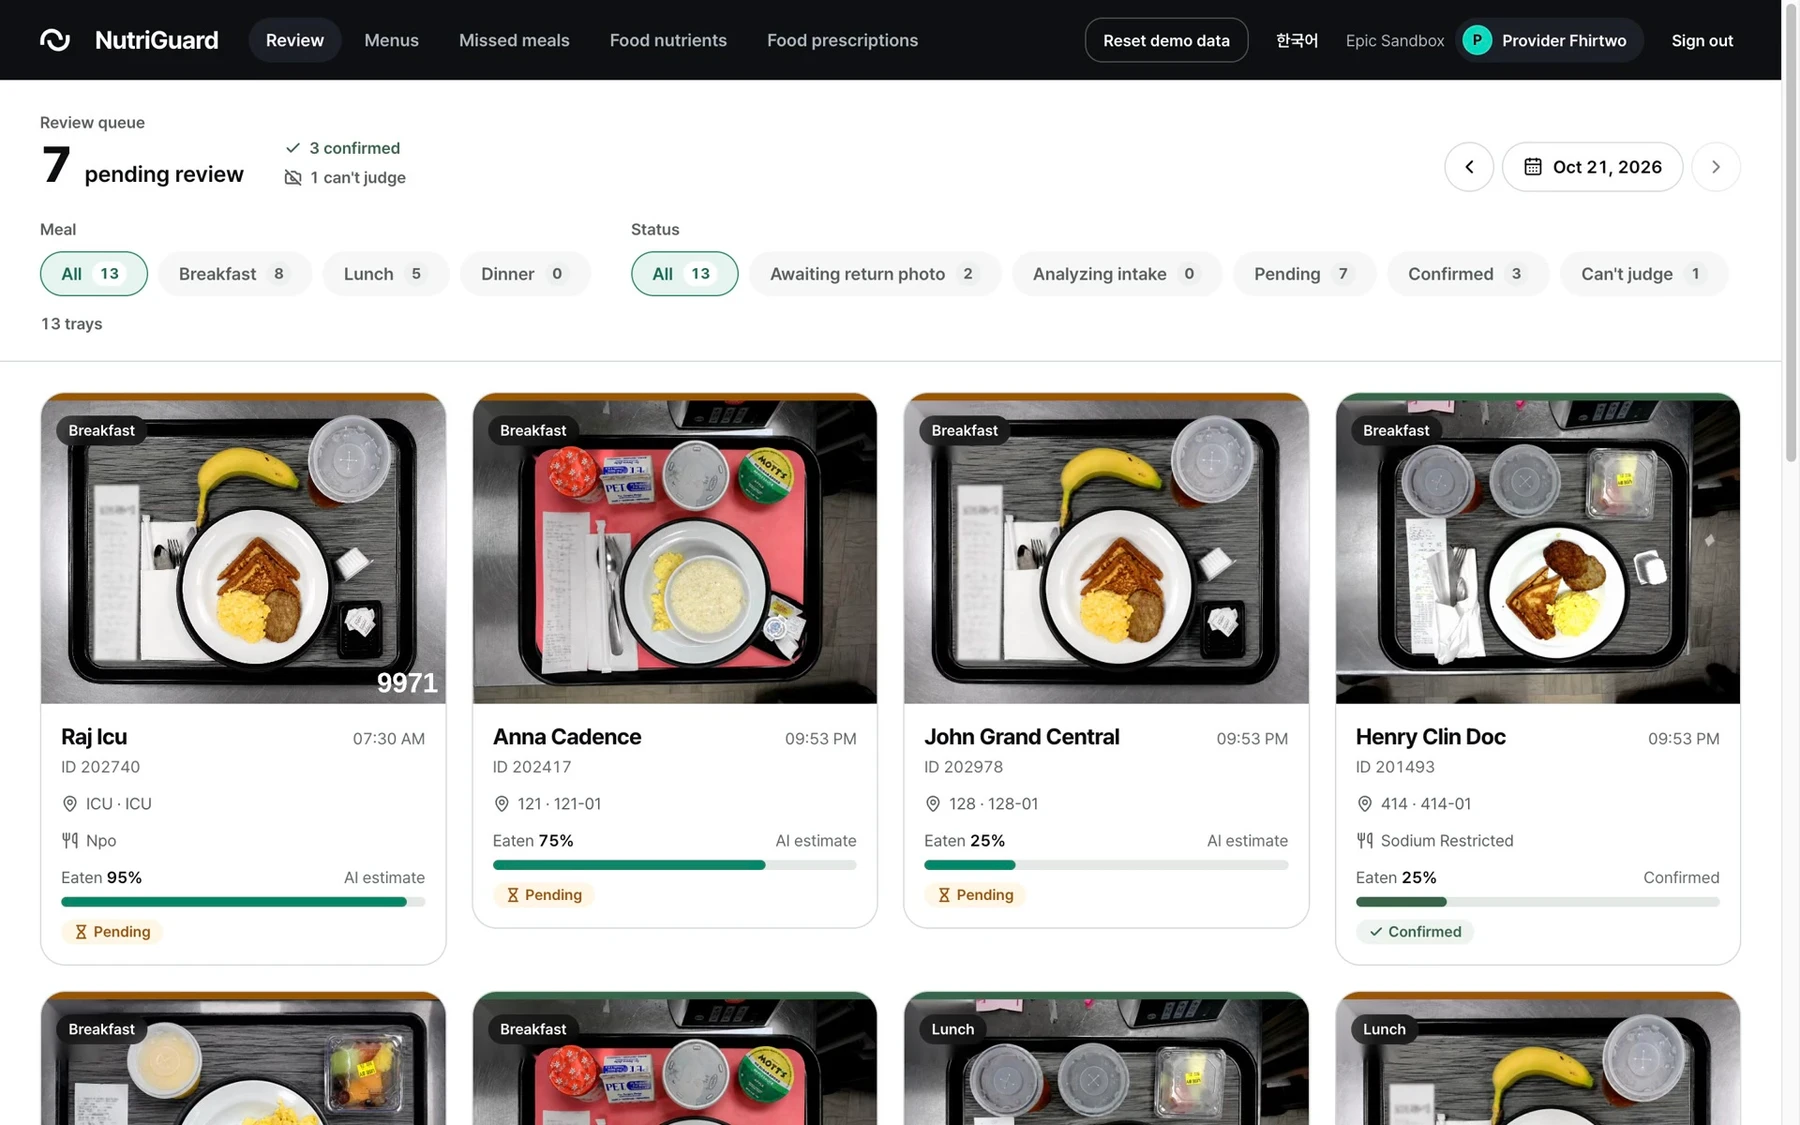
Nutri-Guard AI demo review queue with meal photos and review status

From the kitchento the care team

From meals to dataSCROLL TO EXPLORE

WHY EVERY MEAL MATTERS

Why meal verification and intake records matter

01 / BEFORE DELIVERY

What’s ordered
may not be what’s served

Catch diet, texture and allergen errors before delivery

8%

meal-related error rate
in therapeutic meals

Of the reported errors

97%

were classified as
potentially critical

One Australian hospital · Therapeutic diets · Potential severity classification
Rattray et al · Asia Pac J Clin Nutr · 2018

02 / AFTER THE MEAL

What’s served
isn’t always what’s eaten

Make intake visible for dietitian assessment and physician review

Malnutrition documentation agreement
between dietitians and physicians

Matching recordsDocumentation gap

An assessment can exist without a matching physician diagnosis

U.S. academic hospital · Surgical patients · Before intervention
Levy et al · PLOS ONE · 2023

MALNUTRITION & PATIENT OUTCOMES

Longer stays
More readmissions

Observed differences between patient groups

AHRQ · HCUP Brief 218 · 2016

Average length of stay
4.4daysNo malnutrition code
vs
7.6daysSevere malnutrition code

U.S. adult medical admissions · 2019 · Unadjusted averages
Bhasin et al · J Hosp Med · 2024

From tray verificationto nutrition care

01 / BEFORE DELIVERY

Nutrition AI

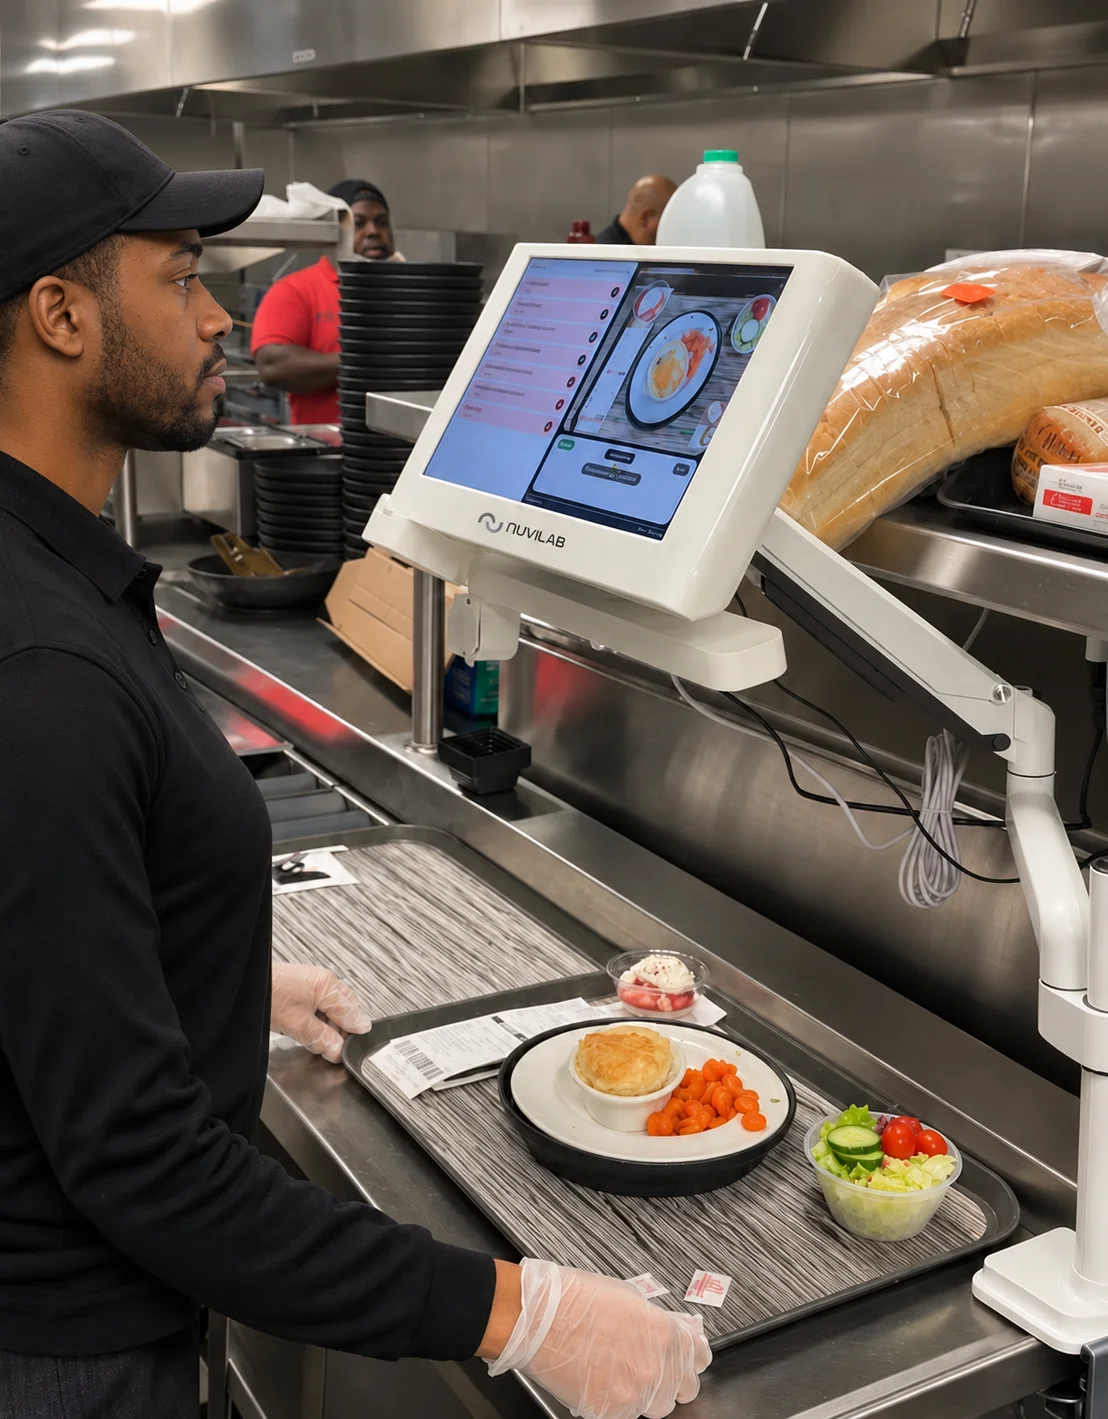
Match trays to patient orders in real time to help prevent meal delivery errors

CHECK BEFORE THE MEAL REACHES THE PATIENT
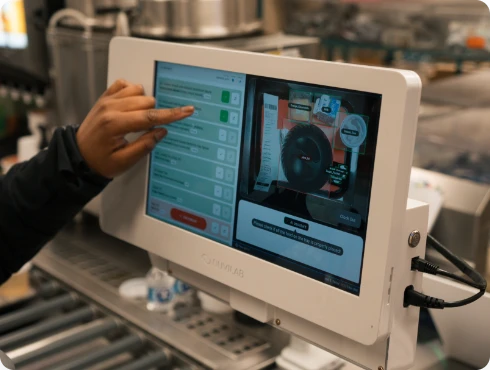
Meal tray review on the Nutrition AI device in a product context scene
  • Meal type: prescribed diet and texture requirements
  • Menu and items: mismatches, missing or extra items
  • Allergens: patient-specific food restrictions
  • Temperature: hot and cold holding thresholds

Keep photos and verification results, and track tray accuracy,processing time and staff activity

Explore Nutrition AI

02 / AFTER THE MEAL

Nutri-Guard AI

Estimate intake from meal photos to support malnutrition assessment

PHOTO EVIDENCE FOR NUTRITION CARE
Nutri-Guard AI demo review queue with meal photos and review status
  • EHR screening at admission
  • Calorie and protein intake for malnutrition assessment
  • Photo evidence for physician diagnosis and coding review
  • Ongoing intake monitoring for care plans
Explore Nutri-Guard AI

At work in U.S. hospitals

Check patient trays against orders and keep photos of every check

U.S. operating footprintOperating city coordinates from the supplied operational-sites HTML Nearby entries are clustered City-level positions, not exact hospital addresses or a hospital countCharlotte, NC, Columbia, SC, Greenville, SC, Monroe, NC, Concord, NC, Winston-Salem, NCLexington, KYMiami, FLHouston, TX, The Woodlands, TXValhalla, NYPensacola, FLLittle Rock, ARJackson, TN, Germantown, TN, Memphis, TNMelbourne, FLCharleston, SCMissoula, MTMetairie, LA, Jefferson, LAAtlanta, GA, Rome, GA, Macon, GAKnoxville, TNBaltimore, MDOakland, CAGainesville, FLBangor, MEPortland, ORLancaster, CA, Orange, CA, Santa Monica, CA, Ventura, CAKansas City, MO, Overland Park, KSCharlottesville, VADavenport, IAChicago, ILTyler, TXCorpus Christi, TX
35+

U.S. hospitals in operation

20,000+

Trays checked each day

NUTRITION AI / OPERATING EVIDENCE98.4%

Photo evidence coverage

Hospital A · U.S. regional hospital with 600+ beds

4,973 tray scans collected · April 24 to May 21, 2026

Hospital and daily tray counts: company figures, September to October 2026

People behind every meal

A foodservice staff member reviewing a tray check on the scanner
01 / BEFORE DELIVERY

Before delivery,verify the tray

Foodservice staff photographing a collected meal tray on a mobile cart in a hospital ward corridor
02 / AFTER THE MEAL

After the meal,record intake

Dietitian intake review — AI-generated illustrative scene
03 / NUTRITION REVIEW

Review intake fornutrition care

From meal photos to intake data

01

Compare

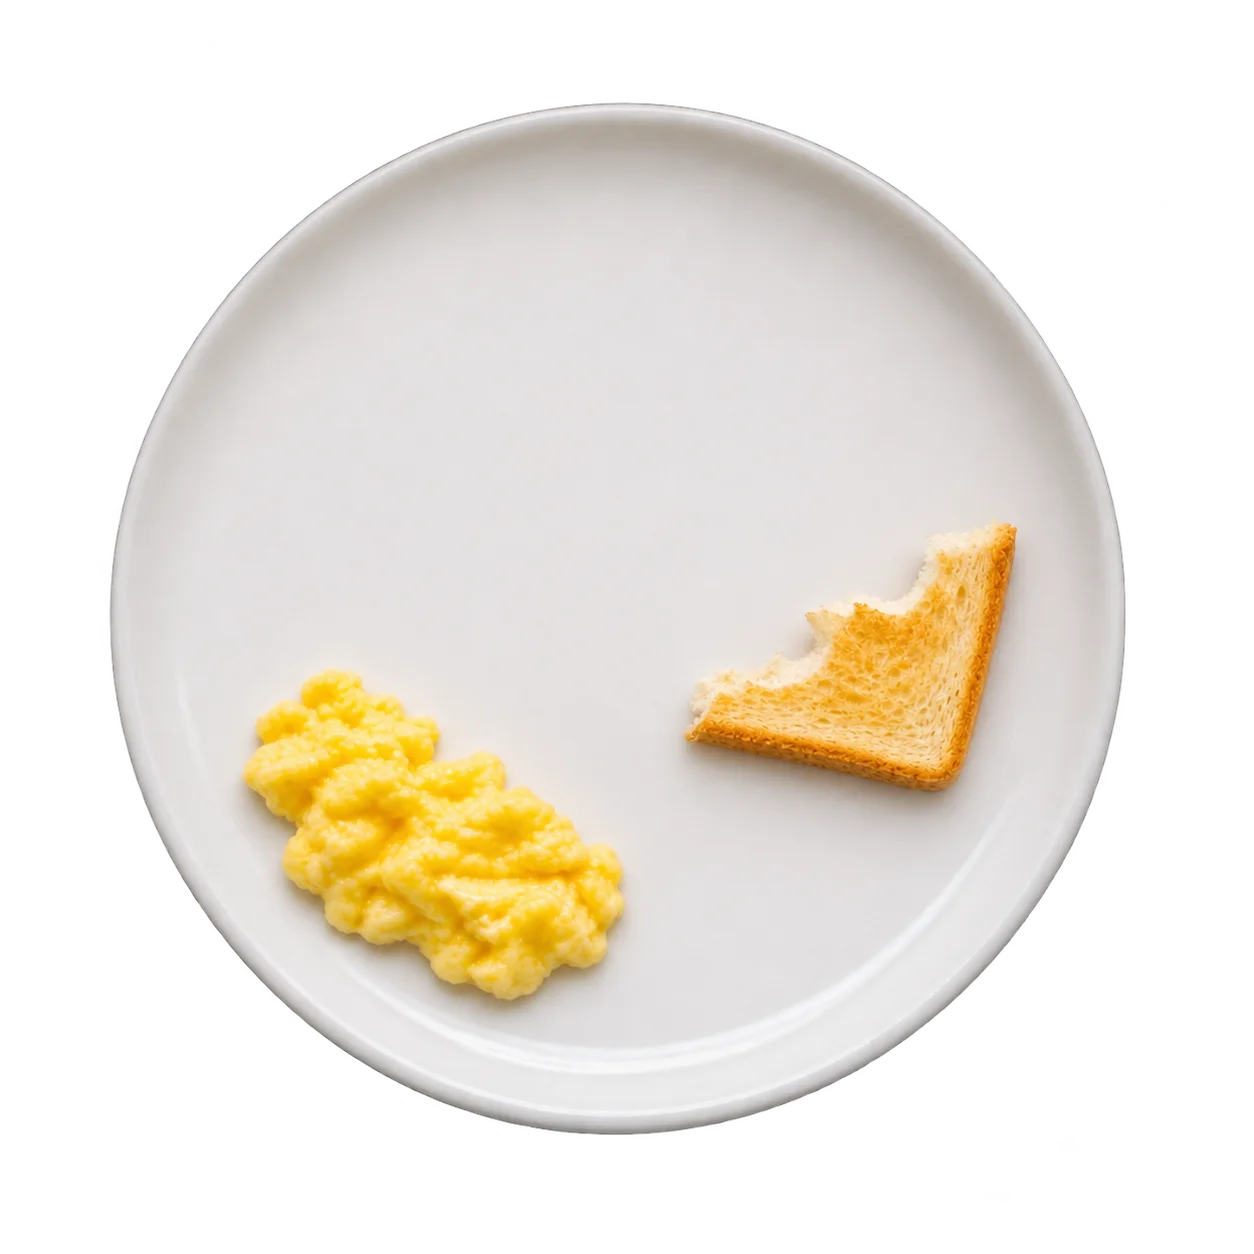
Illustrative served breakfast with toast, eggs and banana
Before the meal
Illustrative returned breakfast with remaining toast and eggs
After the meal
02

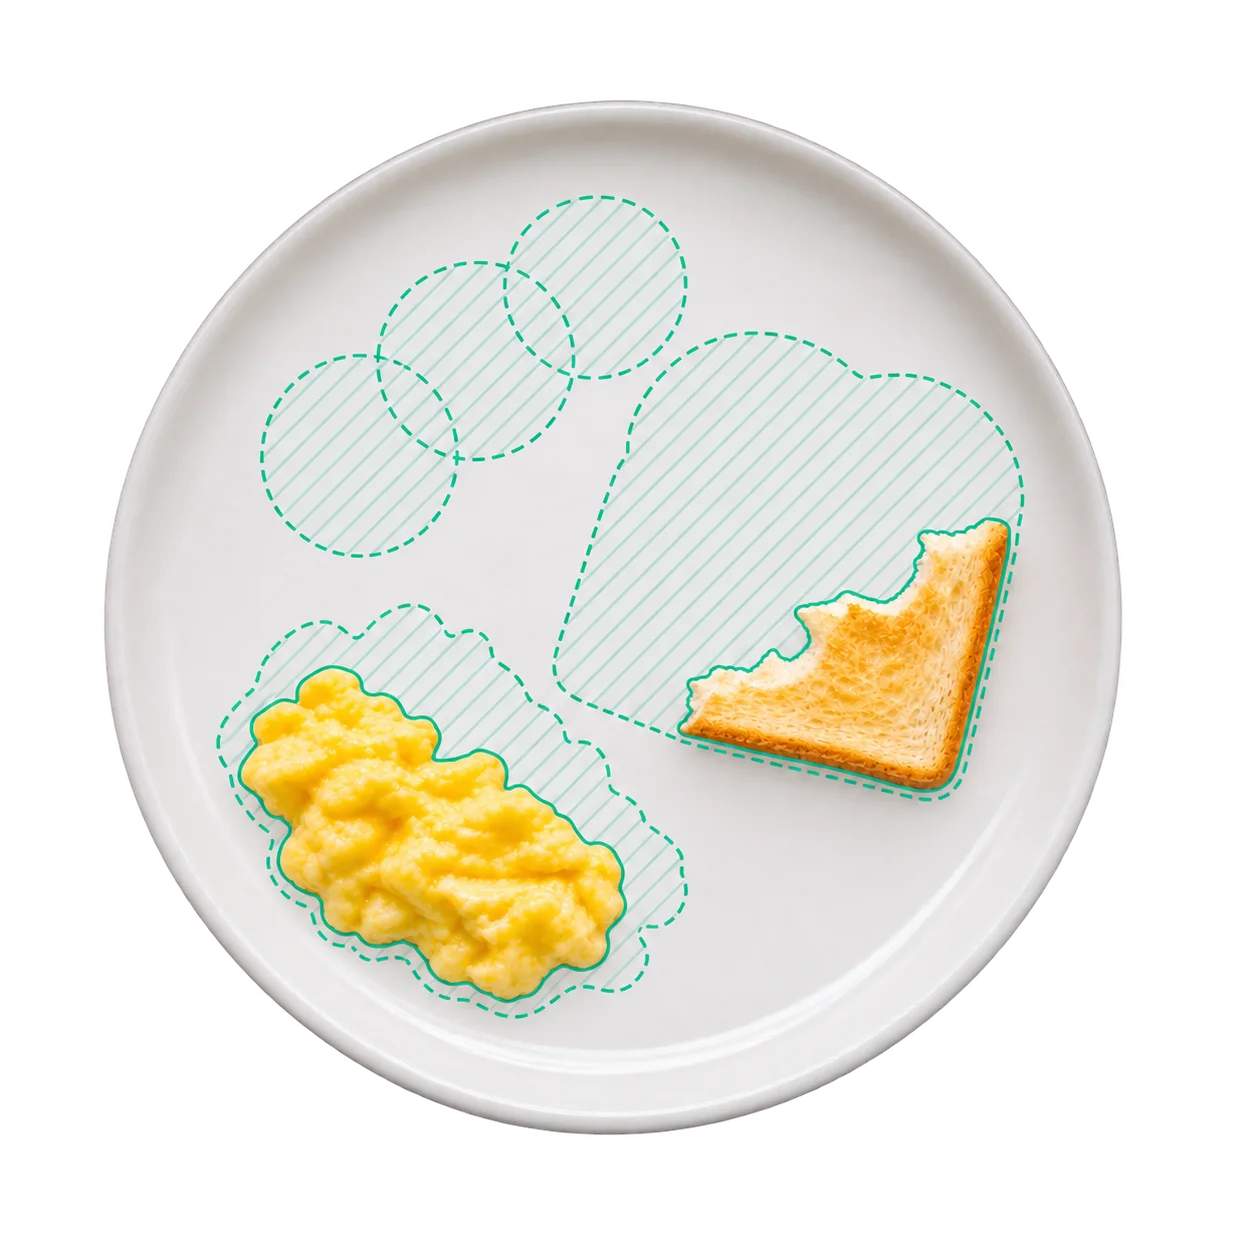
Identify

Food regions and consumed areas marked on the returned breakfast plateBananaToastScrambled eggs
03

Estimate intake

Estimated intakeSample analysis
75%
50%
100%
166kcalCalories
7.3gProtein
19.9gCarbs
6.5gFat

Partners and recognition

Compass Group
Aramark
Carleton University
Alexandra Hospital
The FoodTech 500
The FoodTech 500No 11 globally ·
CES Innovation Awards
B Corp
B Corp Certified
Google for Startups
Circular Economy cohort

Healthcare’s missing piece
Real meal data

We track sleep and activity, yet daily food intake often relies on memory

Nuvilab turns measured meal data into insights for nutrition care and everyday decisions

NUVILAB DATA

Meal data
at global scale

120M+
Illustrated growth from 2020 to 120M+ food-item analyses in November 2026Year markers illustrate the passage of time, not measured annual totals Intermediate counts are unavailable; only the current platform-wide cumulative analysis count is reported by the company2020 · Illustrated growth milestone2021 · Illustrated growth milestone2022 · Illustrated growth milestone2023 · Illustrated growth milestone2024 · Illustrated growth milestone2025 · Illustrated growth milestone2020202120222023202420252026
Three-dimensional mint Nuvilab symbol on black

From mealsto better care

Talk to our team