Case 01
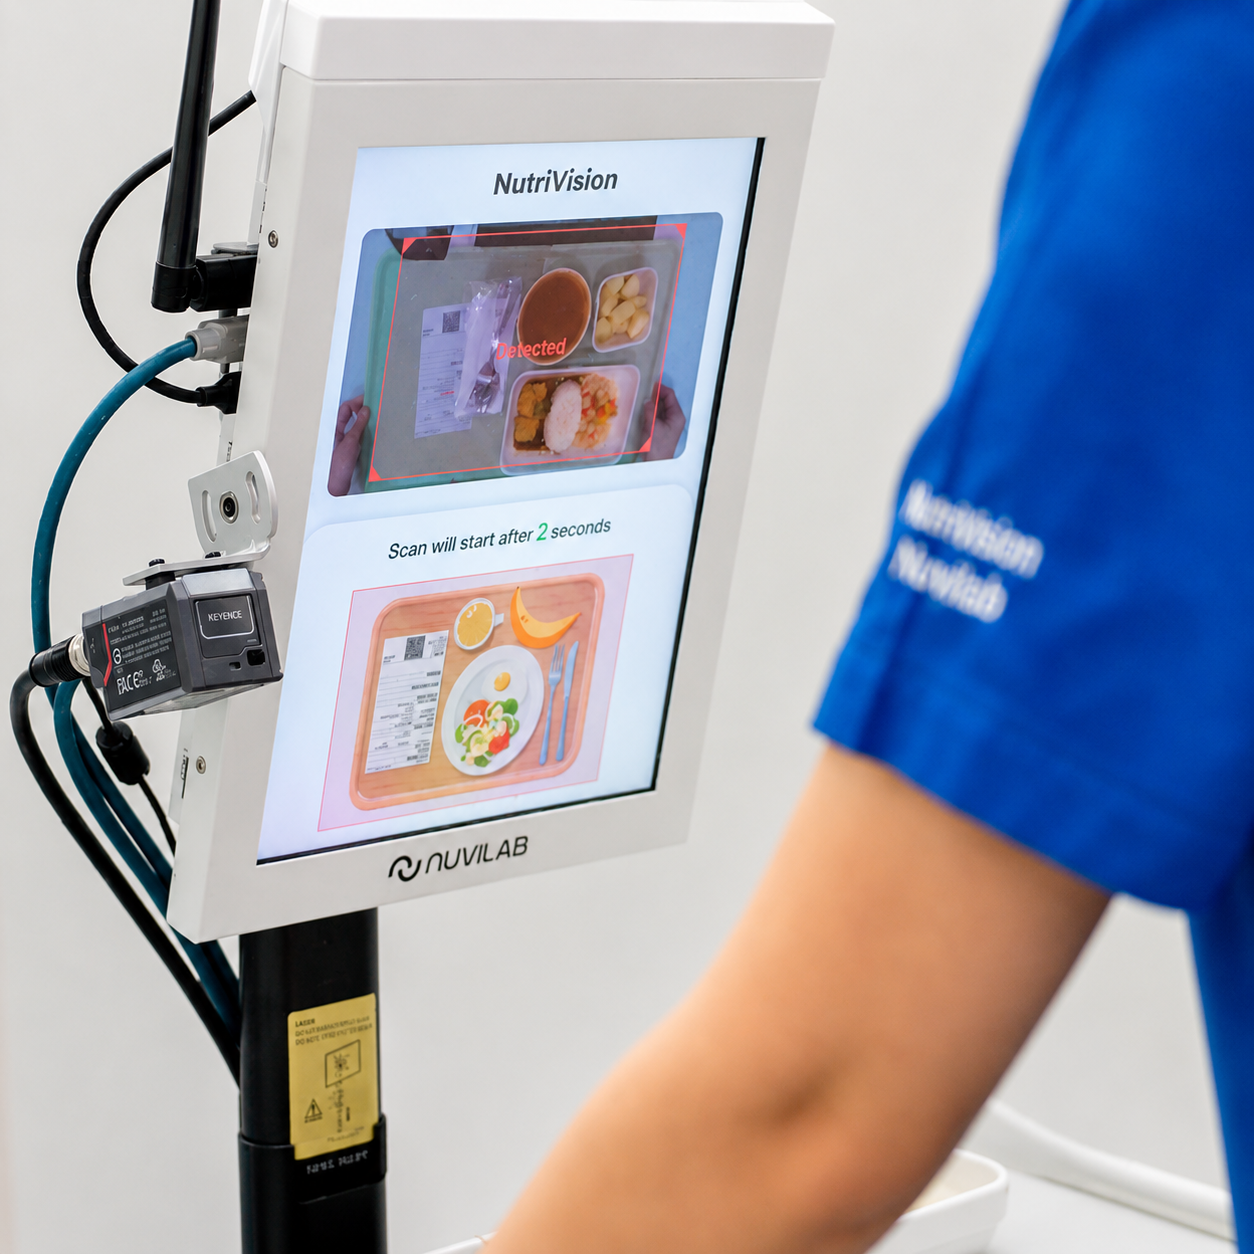
Alexandra Hospital · NUHS
94%
AI intake accuracy
1,400
Beds in expansion pipeline
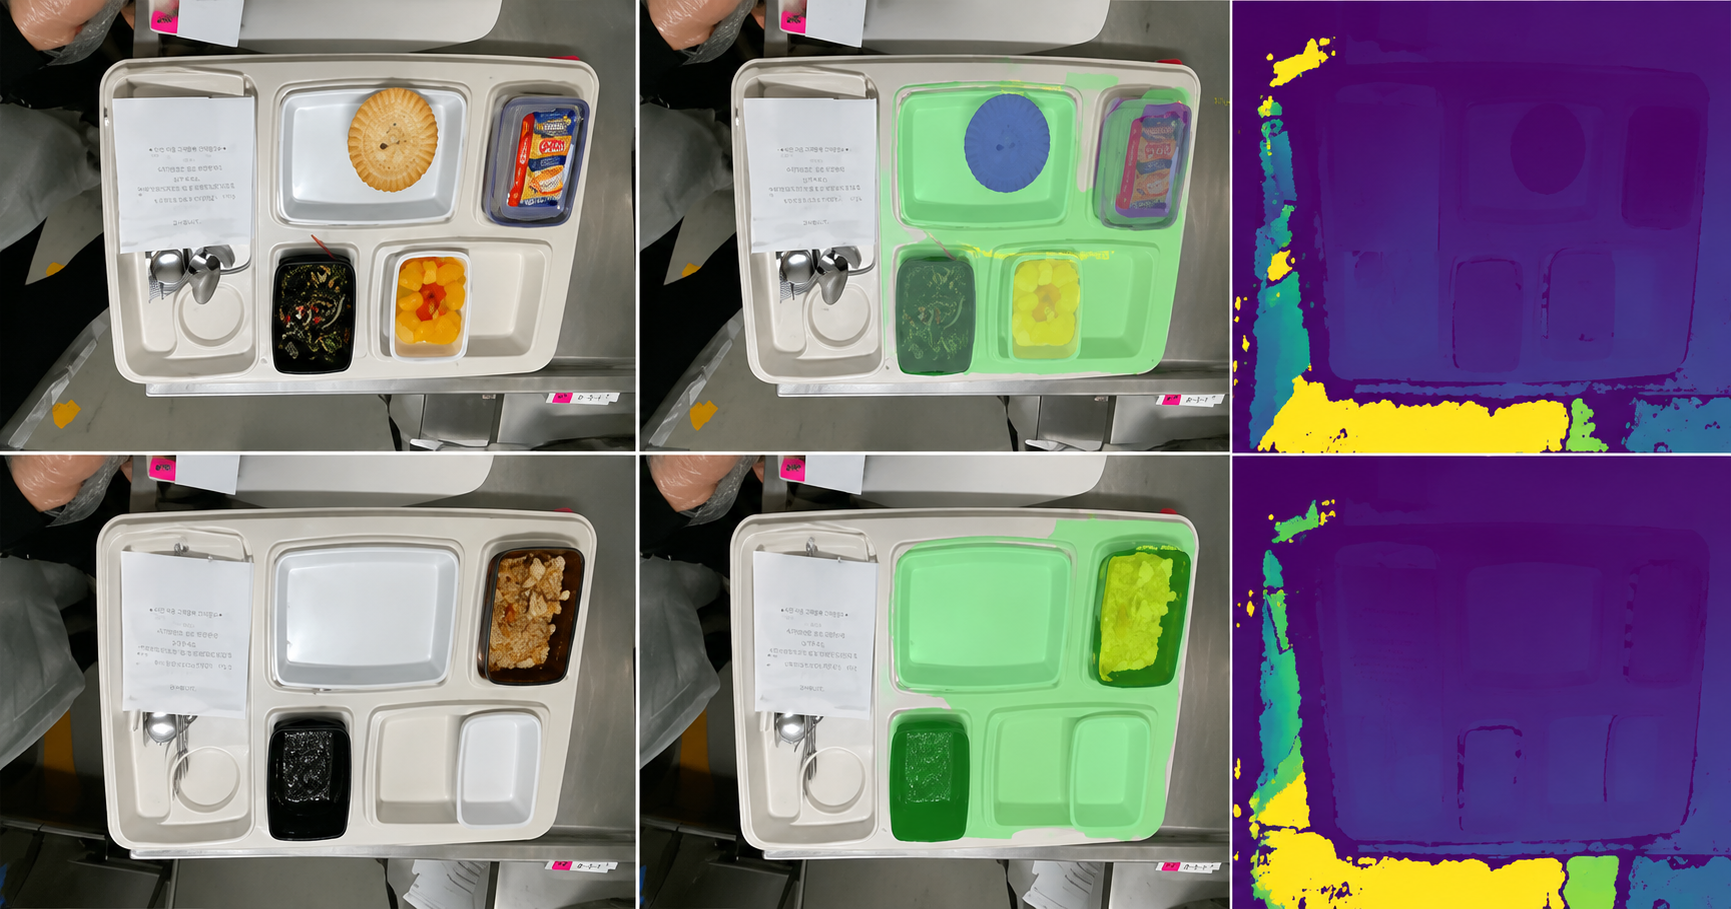
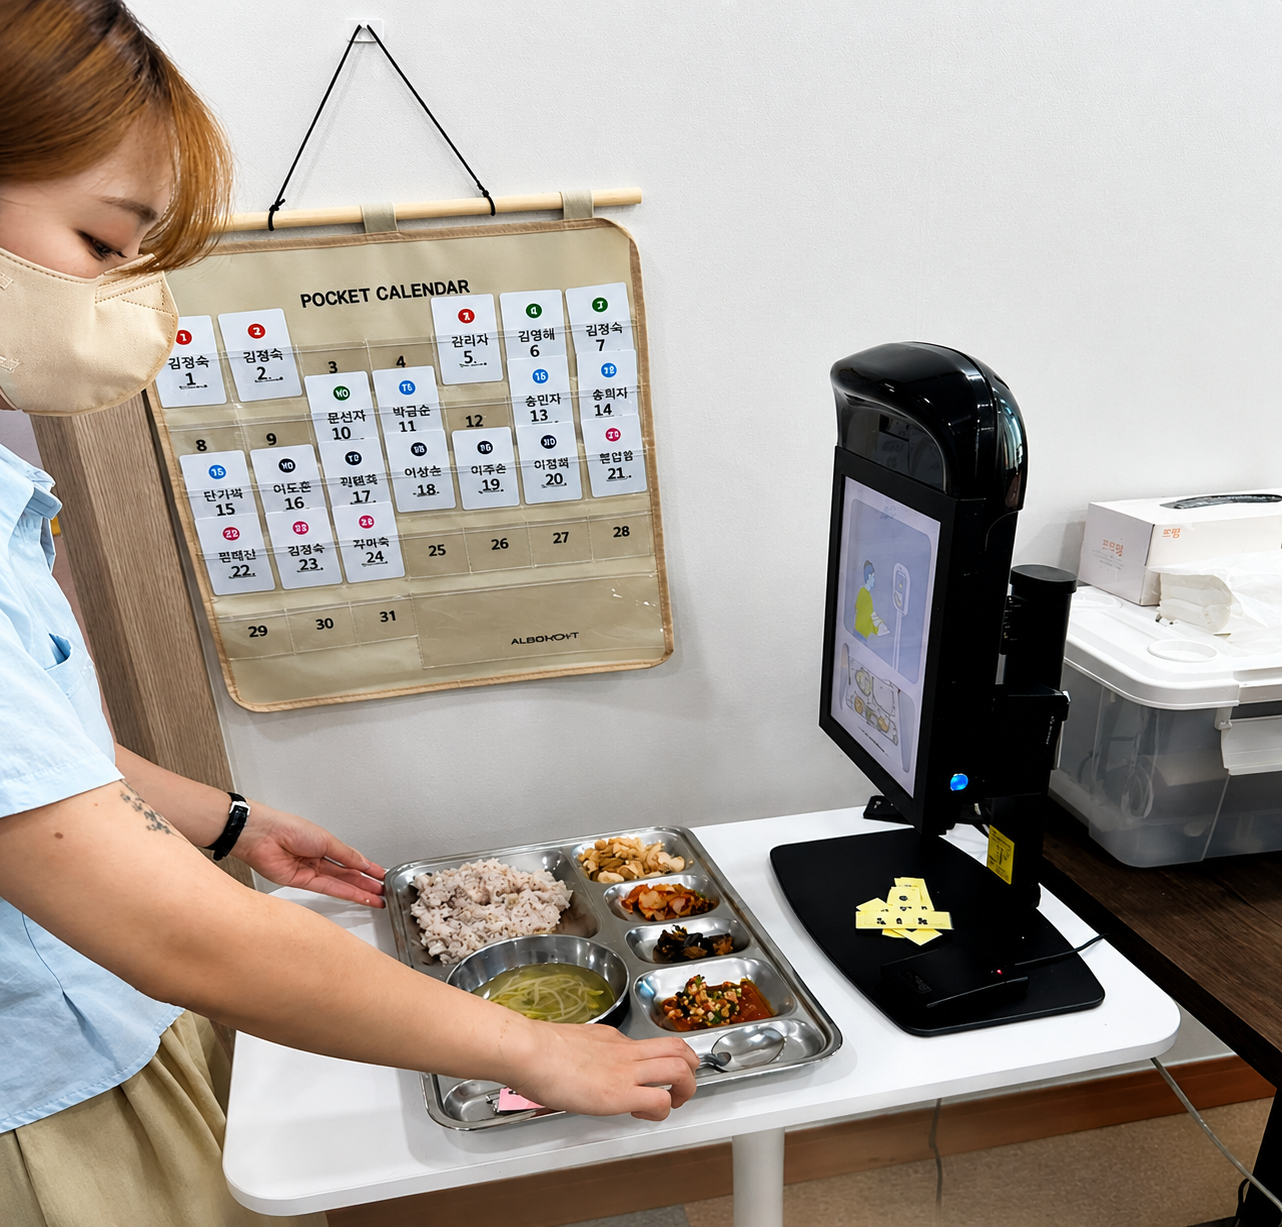
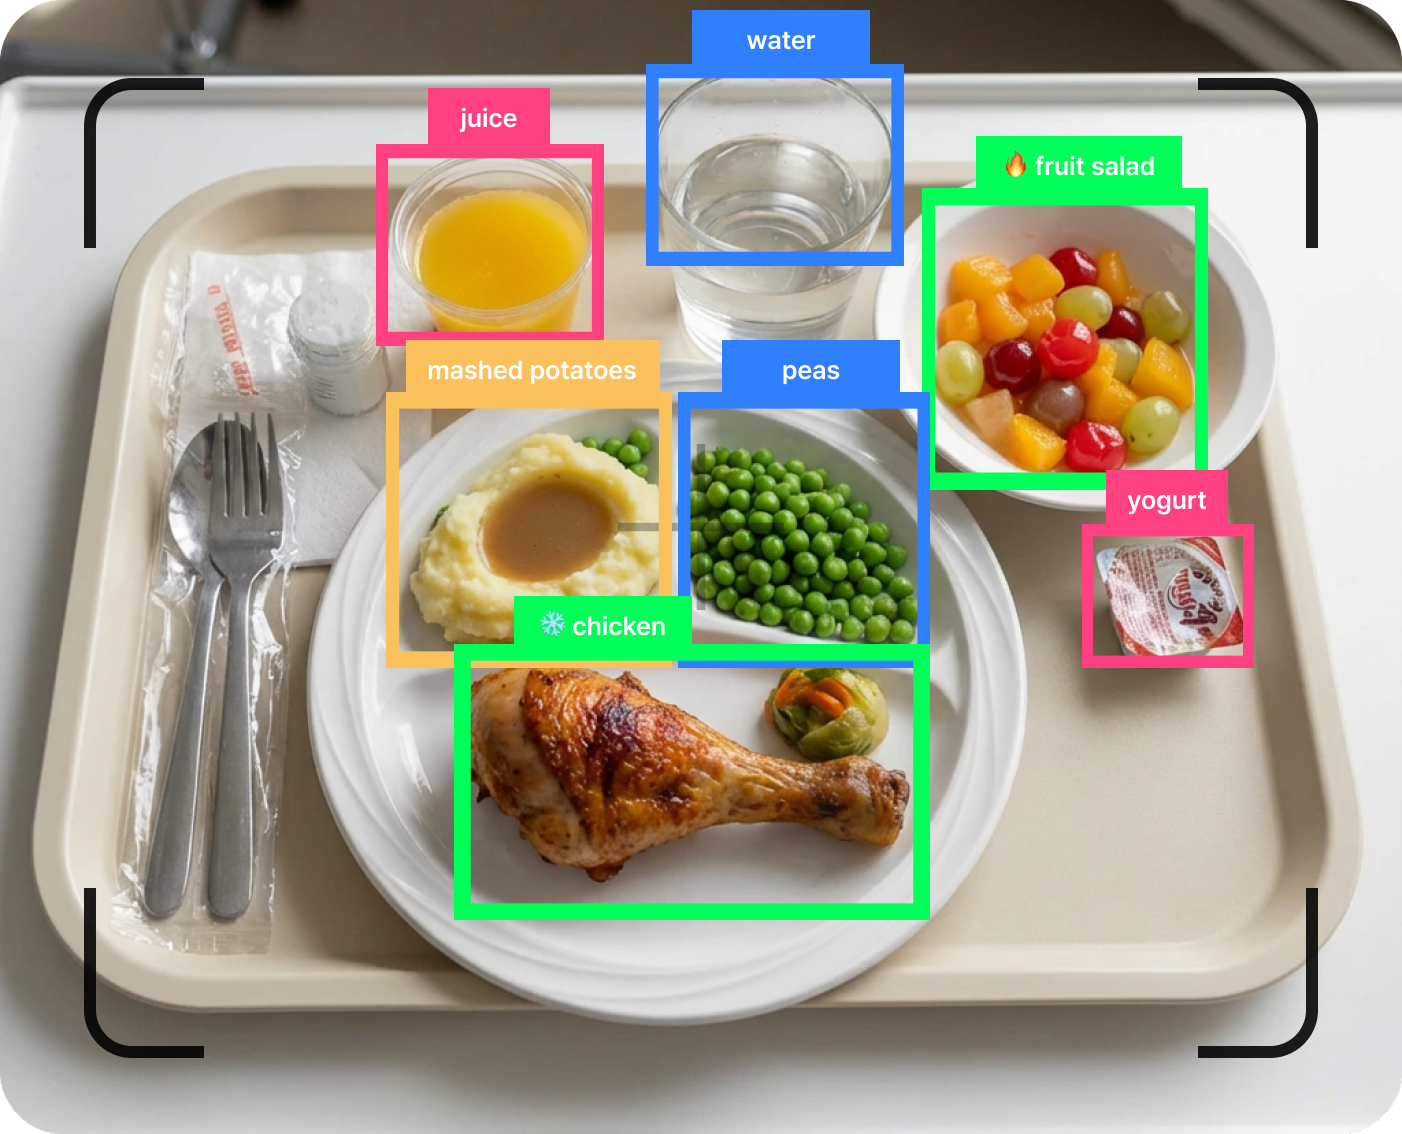
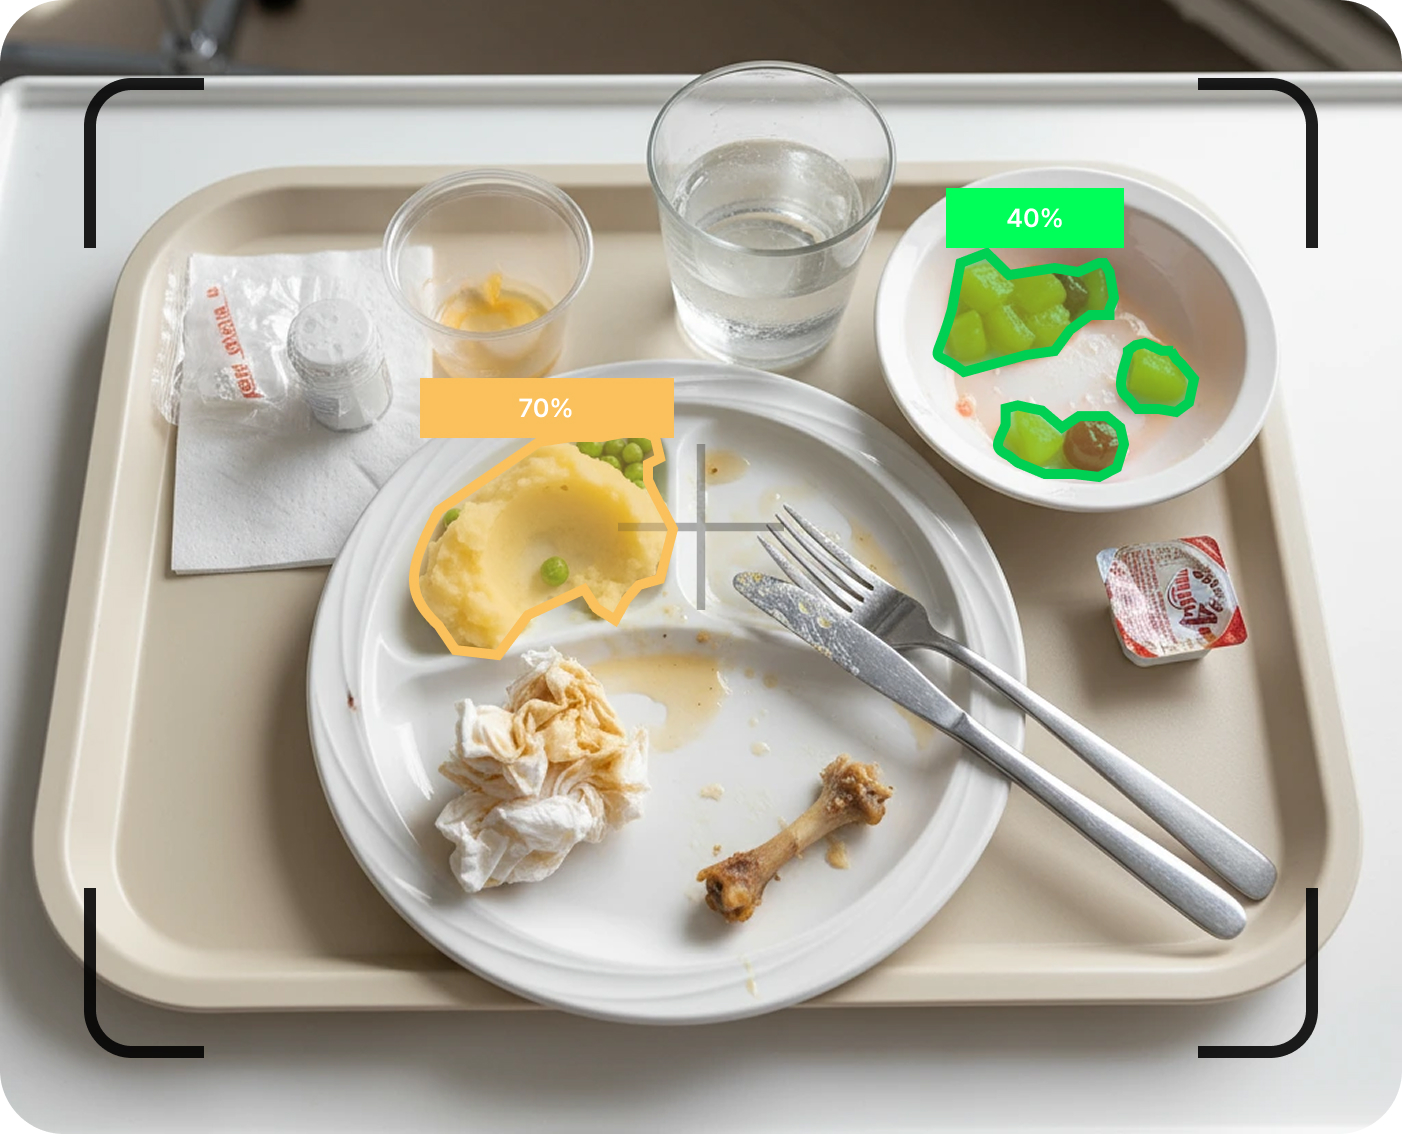
RFID tray scanning replaced manual intake charting — AI outperformed nurse estimation every single month.
between estimated inpatient malnutrition risk and the rate at which it actually gets coded on the bill.
Recall-based charting introduces variability that undermines clinical confidence and audit defense.
Without objective proof, coding teams routinely downgrade or reject malnutrition claims.
Valid malnutrition cases sit unbilled because the supporting evidence was never captured.
recoverable for a representative 400-bed hospital — sitting unbilled because the evidence was never captured.
Source: Journal of Hospital Medicine, 2024 · Nutrition in Clinical Practice, 2021. Illustrative financial model based on a 400-bed hospital with $200M Medicare revenue.
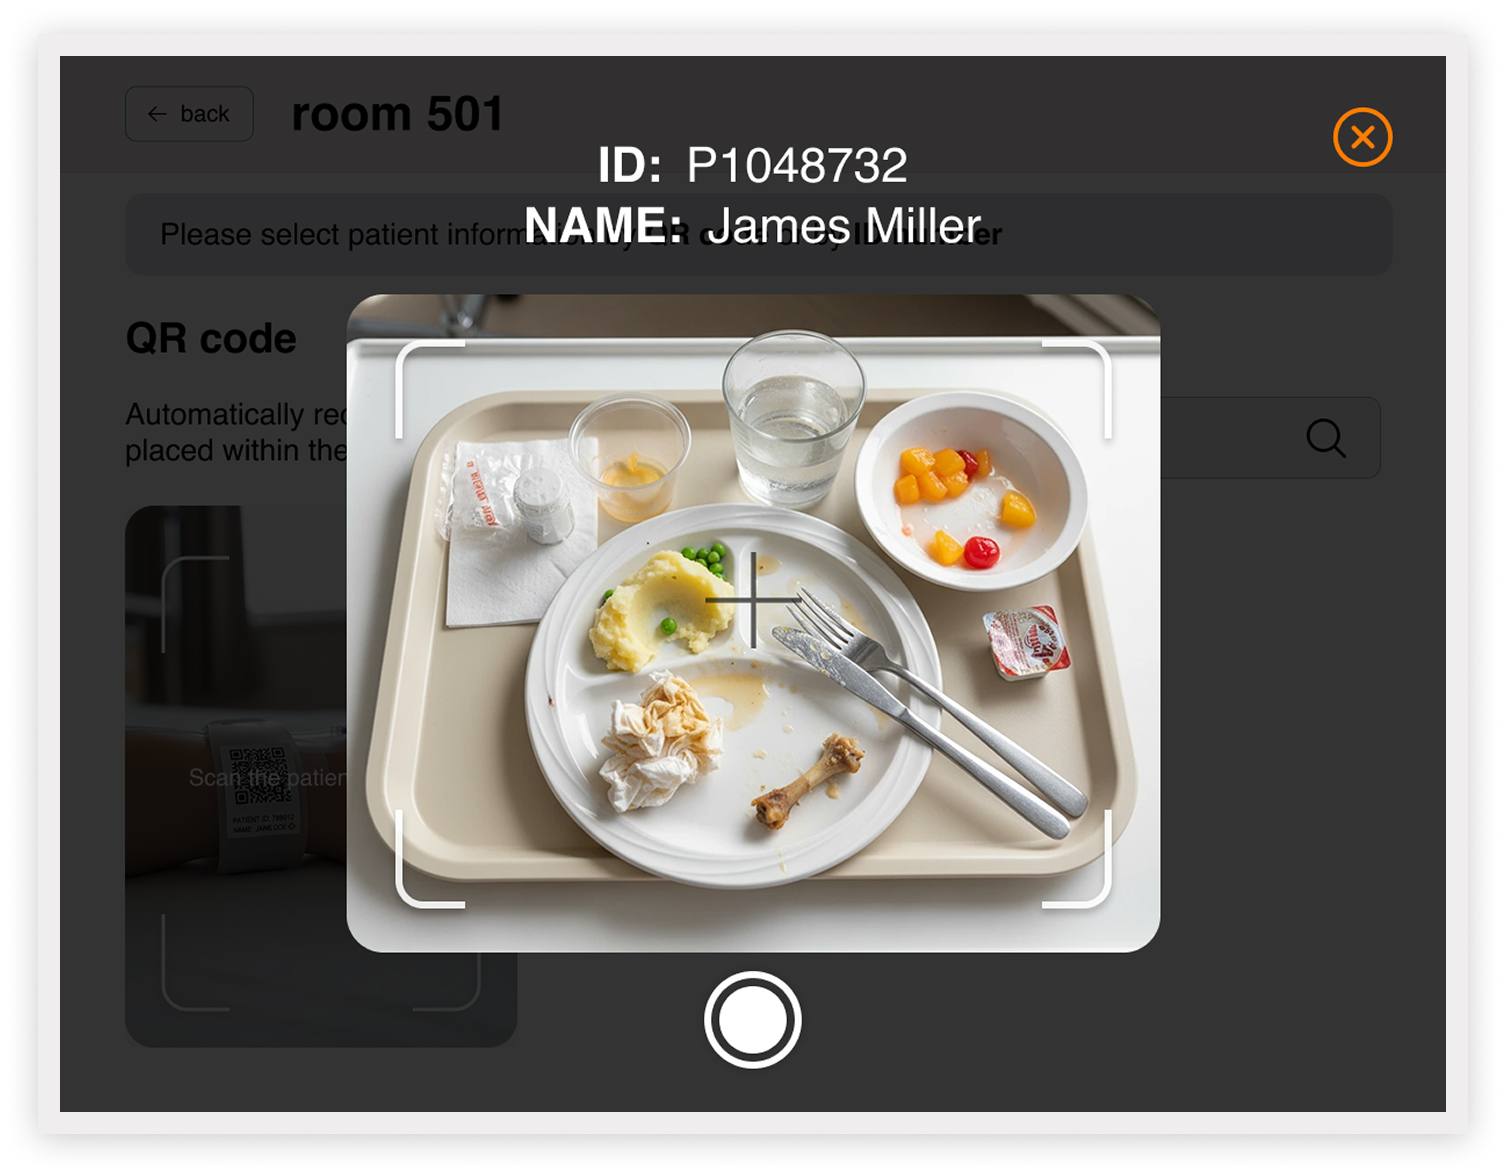
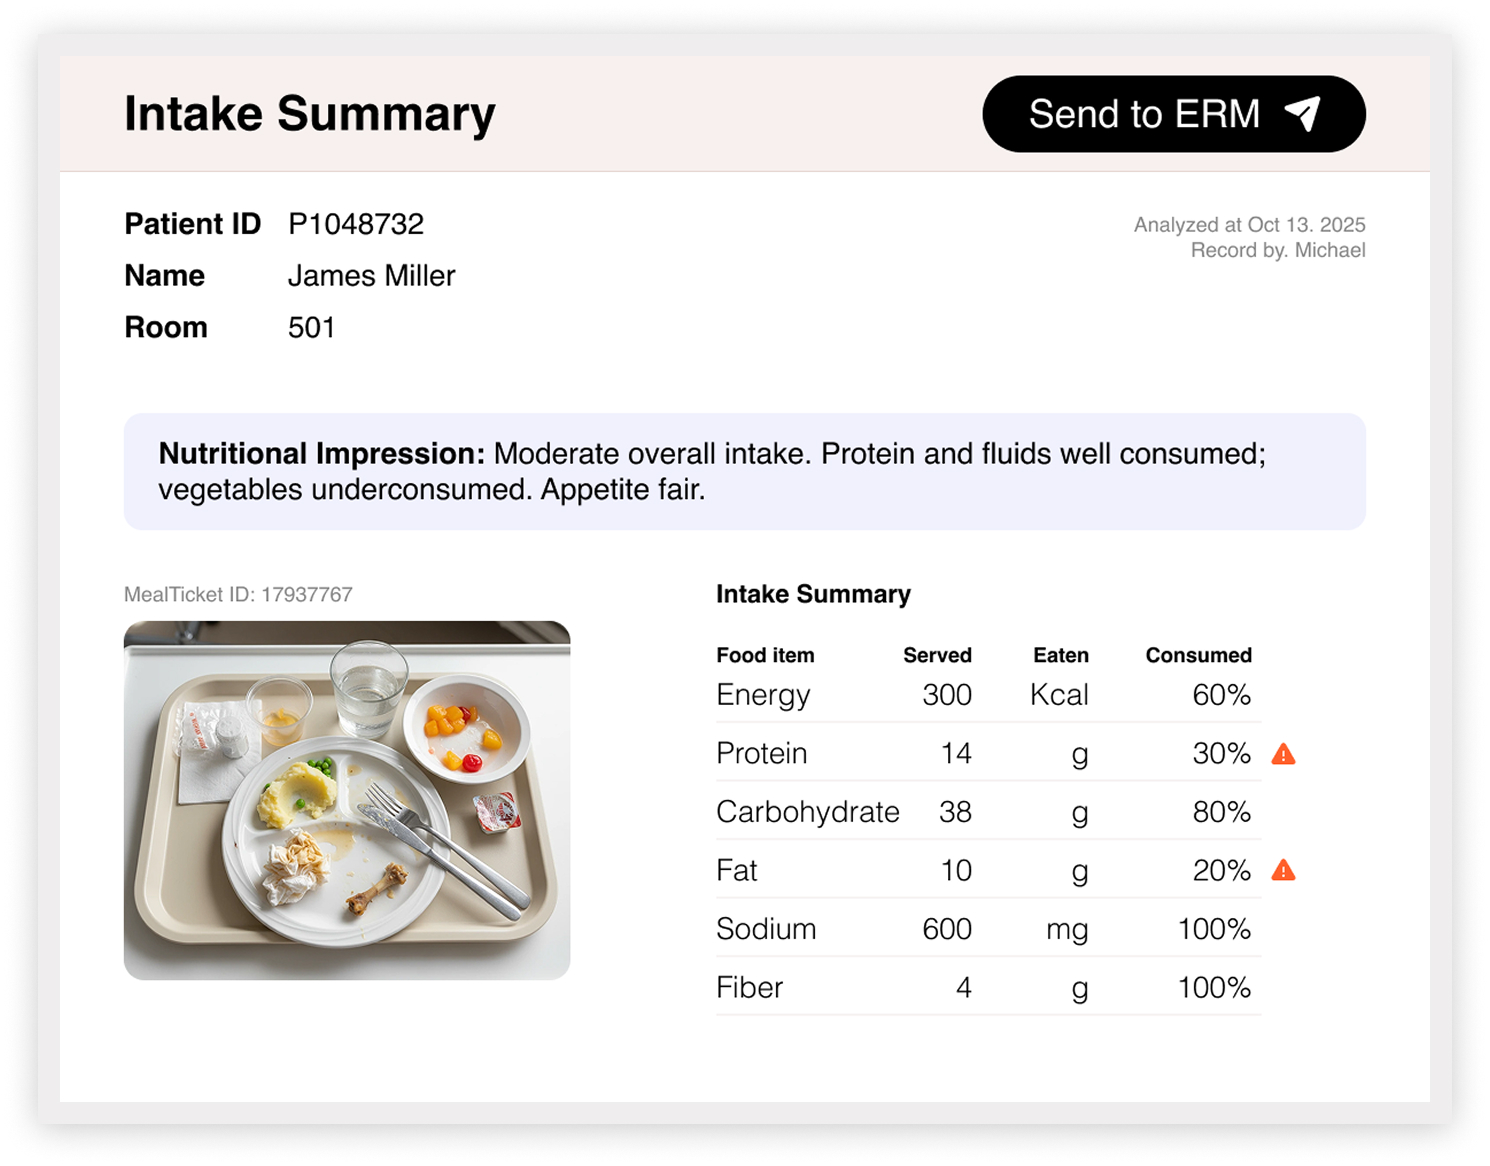
Nutri-Guard AI sits in the existing meal-service workflow and writes structured evidence directly into the EHR. No new device. No extra clicks for the RD.